SoftNAS Performance on AWS
- Admin
- Riad Mahamudul (Unlicensed)
- Former user (Deleted)
Symptoms
The wrong sizing selection may cause slowness, failovers and even outages. In addition, it may lead to a wide range of false alarms specially in HA mode, where both machines are unable to check each other.
Purpose
How to collect a related and useful AWS cloudwatch data to decide if you are on the correct instance size and/or storage type or not.
Also It will help our support team and solution architect with reviewing the overall performance of the instance.
Resolution
Introduction
Network IO, EBS throughput and Instance CPU load are crucial metrics for SoftNAS appliance to work properly specially in HA cluster mode. At some cases, SoftNAS support team are interested in some AWS cloudwatch metrics that will help them precisely determine the root cause of any issue you are facing. This article is describing how to collect useful data from cloudwatch to help our support with their analysis.
I Network:
When it comes to network measurements we are interested in the summation of the maximum of NetworkIn and NetworkOut, we can generate them using cloudwatch as below:
1- From cloudwatch >> Metrics >> EC2
2- Filter by instance name and Network
3- Select NetworkIN and NetworkOut

4- Click “Graphed metrics” tab, from “Statistics” Choose Maximum [for both metrics]

5- Zoom into the area of interest and from the drop-down menu before “Actions” choose “Stacked area”

6- Do that for both instances
II CPU:
For CPU, we are only interested in the maximum value for CPUUtilization metric, and you can draw it for both machines on the same chart as follows:
1- From cloudwatch >> Metrics >> EC2
2- Filter by CPUUtilizations and check the instances names
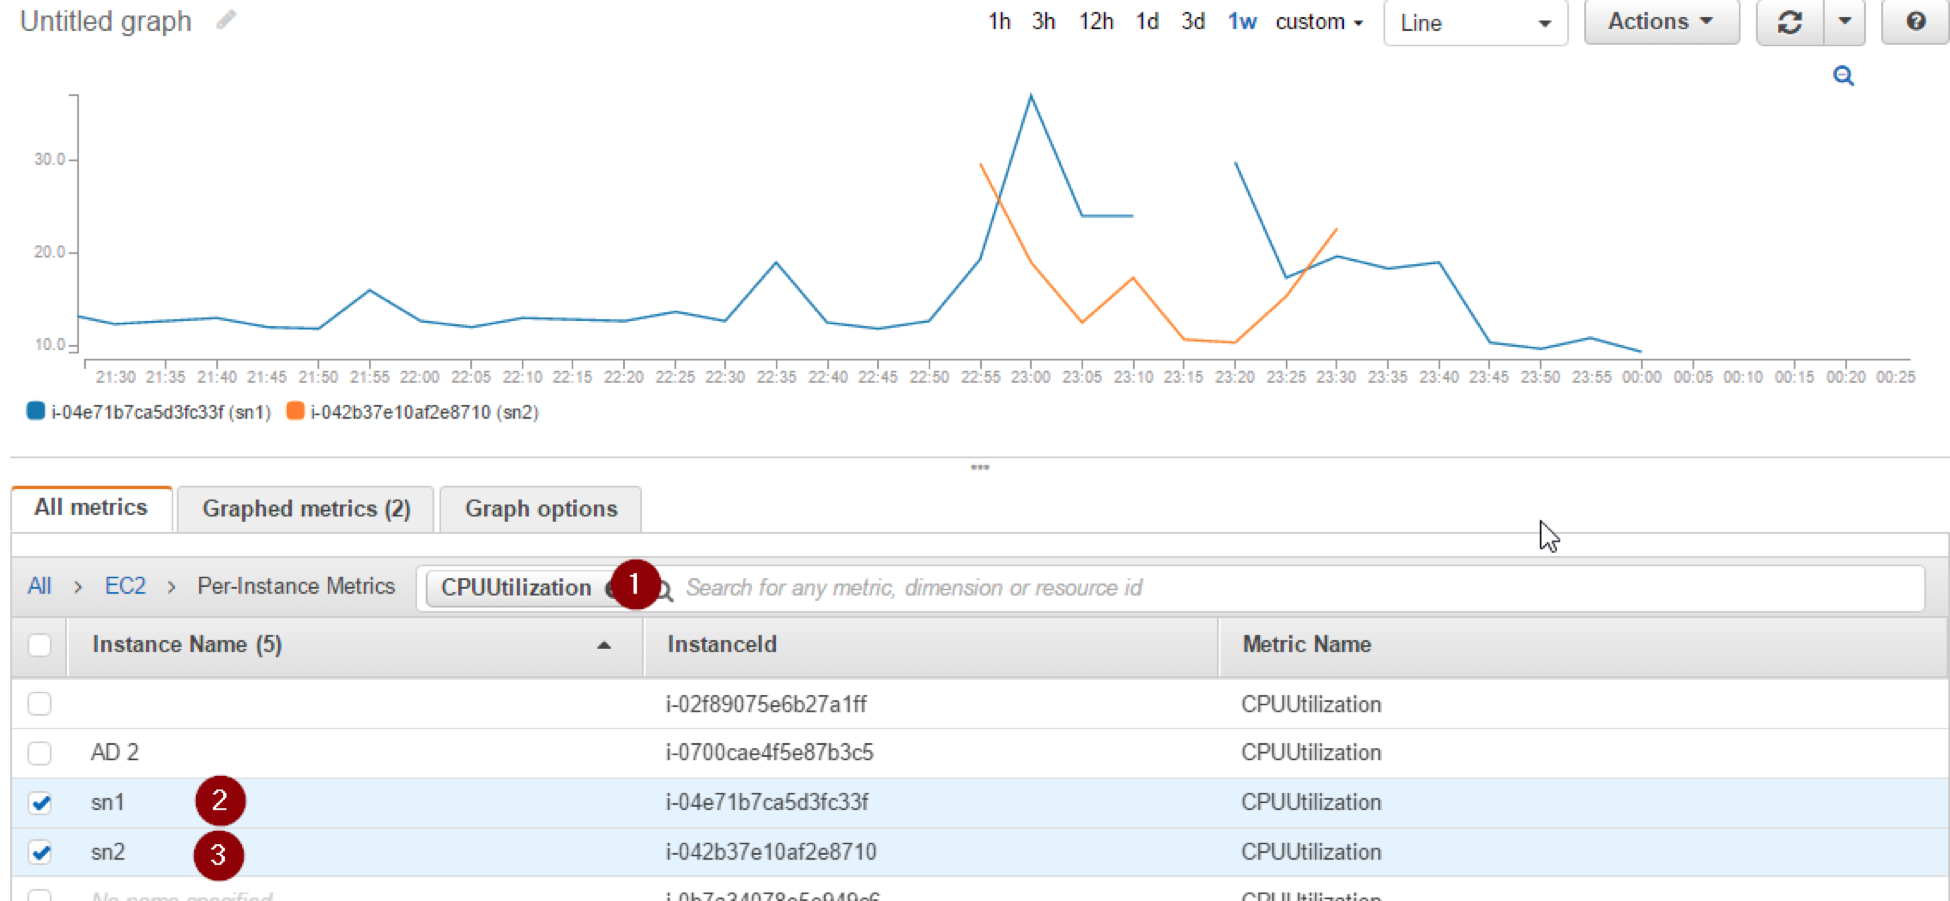
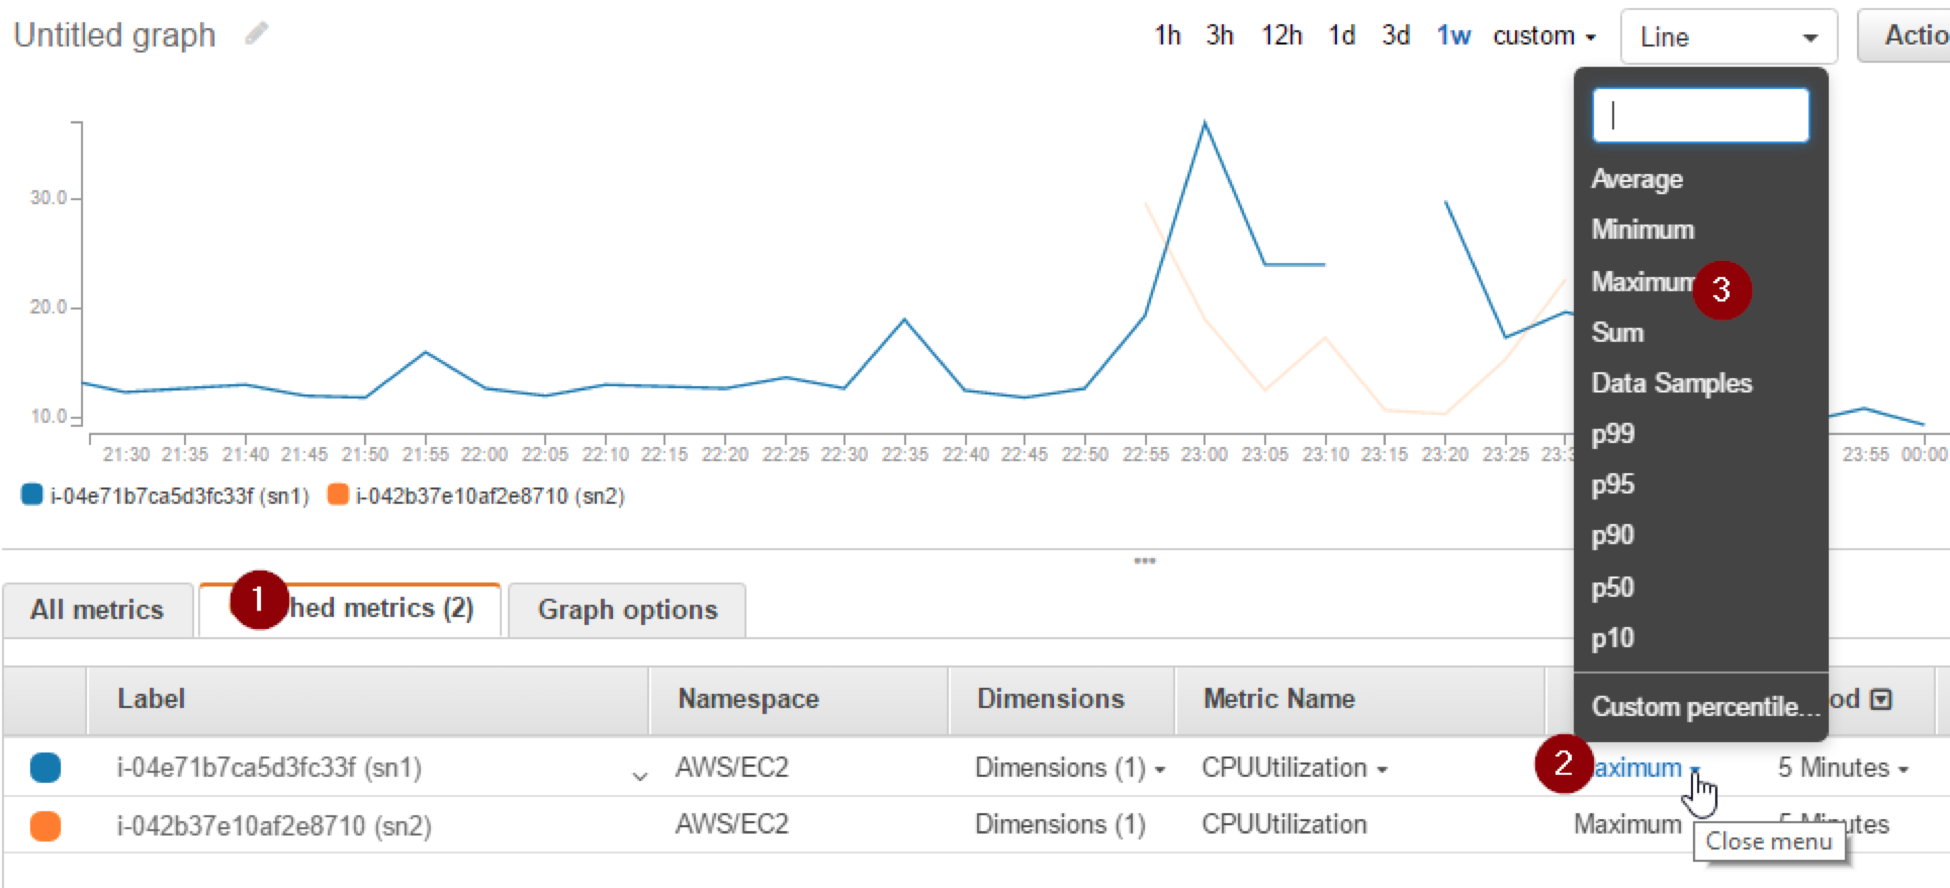
3- Click “Graphed metrics” tab and from “Statistics” Choose “Maximum” for each metric
III EBS volumes
One of the major storage issues is the IOPS bottlenecks, when you are trying to pull/push a big amount of data through a tight hose, so you will suffer from high iowait time and a big increase in the memory that will badly effect the system.
Each instance type got a certain limitation on the throughput of storage traffic between the instance and EBS, we can have an overview of the total number of bytes per all volumes:
1- From Cloudwatch >> EBS
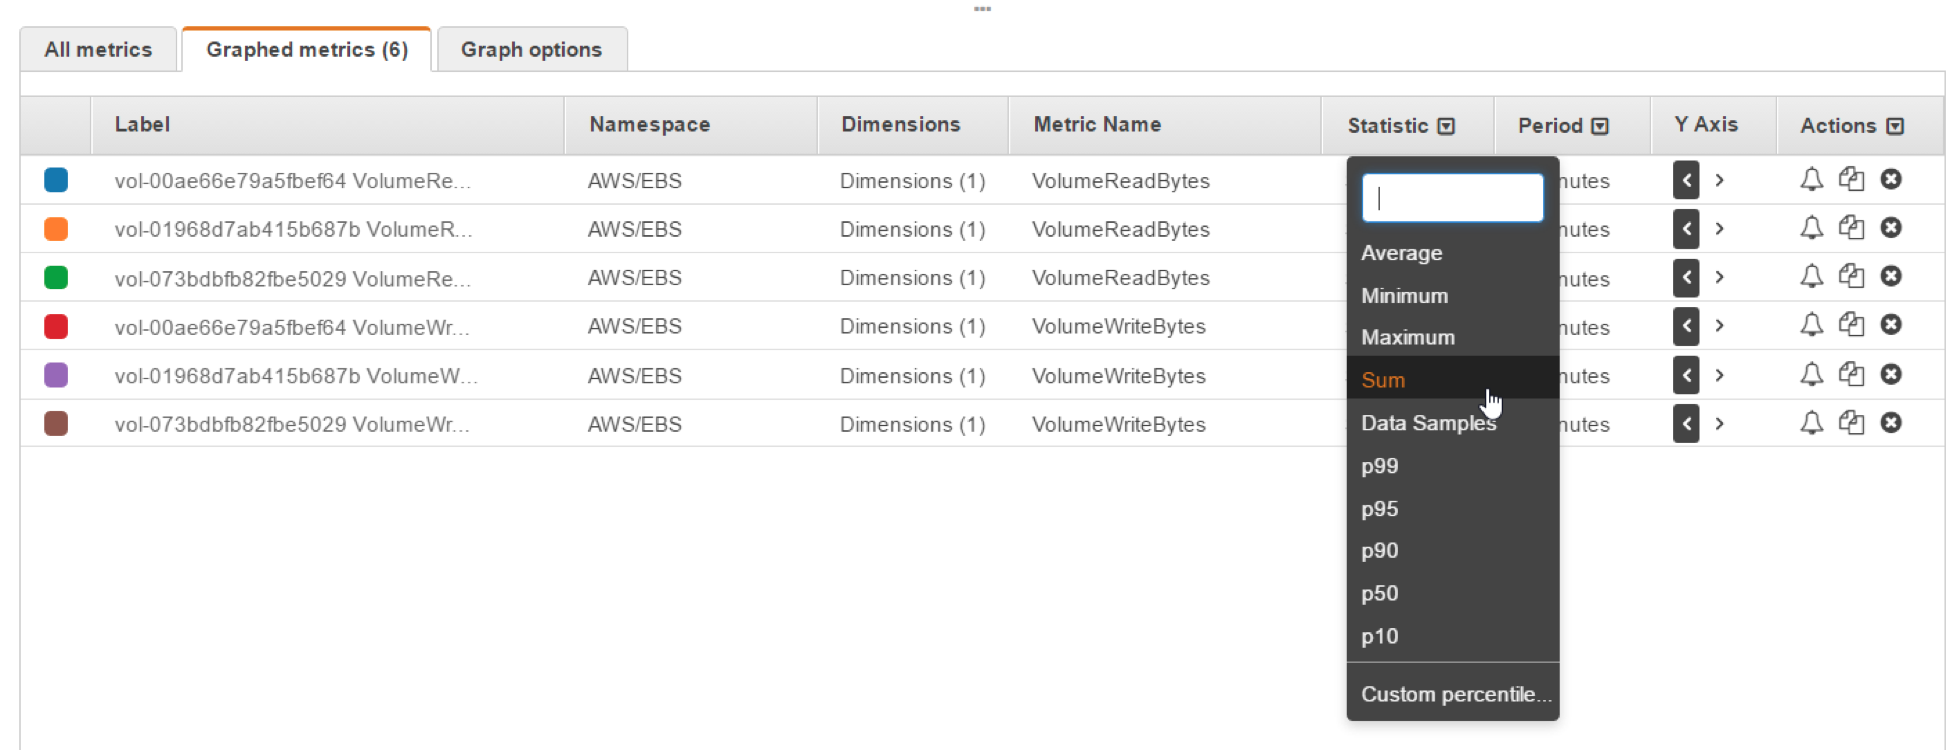
2- Filter using the VolumeReadBytes and choose all your volumes

3- Repeat for VolumeWriteBytes

4- From Graphed metrics click on the Statistics dropdown menu and check Sum
5- From Graphed metrics click on the Period dropdown menu and change it to 1 Minute
6- From the graph options before “Actions” choose ‘Stacked area” from the dropdown menu, and Now we have an indication for the number of bytes per minute
7- Repeat for the second instance
Pre-support Analysis:
SoftNAS HA highly relies on the link between the two instances in addition to the proper communication between each instance and its storage backend and it uses it for checking the health of each machine, and if something is affecting the link between them [for example the very high NetworkIO or IOPS demand] that will lead to “Storage heartbeat failure” errors, NTP and IAM warnings and will also lead to false positive failovers especially in non-EBS optimized instances.
You can easily check your instance type Maximum EBS throughput from the below link, then compare it with your EBS results, and if it exceeded that, you have to think about resizing to another instance type that supports higher bandwidth based on the same link also: http://docs.aws.amazon.com/AWSEC2/latest/UserGuide/ebs-ec2-config.html
Note: Cloudwatch metrics are per Minute and the numbers in the link are per second
Additional Information
https://docs.aws.amazon.com/AmazonCloudWatch/latest/monitoring/acw-ug.pdf
Update History
| 01-03-2018 | Template Created |
| |