Performance Issues Troubleshooting
- Admin
Symptoms
There are many a times that we find a server performing slow compared to previous days or sluggish or in a worst case system responds slow i.e running a simple command would take more time to respond.
Identifying bottlenecks at this point of time would need a proper system analysis.
Purpose
This guide would serve as a reference to help determine where performance bottlenecks may be stemming from.
Resolution
This knowledge base article will provide the basic requirements involved in troubleshooting poor system performance.
Finding and diagnosing performance bottlenecks with SoftNAS involves examination of a few components. These components are explored in details below:
- Network: The IO limits of the network interface on the SoftNAS and the IO limits of the network interface of the client consuming the storage endpoints.
- Disk: The IO limits of the disk device types that the storage pools resides on (Block or Object).
- RAM: Available RAM on the SoftNAS instance.
- CPU: CPU consumption and load.
- Client Types and Protocols: What OS configurations and mount options should we consider on the client?
- Throttling: Any throttles in the pipeline coming from the cloud fabric backend?
- Housekeeping: Disk space issues often caused by core dumps and logs, zfs fragmentation etc.
Network, Load, and IO Wait
CPU load is an indicator of how many processes are waiting in the CPU execution queue to processed. As load increases, time to execution increases, therefore making things 'slow'.
IO wait is a condition where the CPU is waiting on acknowledgement of an IO operation. In SoftNAS context, this will be a disk operation (read or write to object or blob) or a network operation like get, put, send, or recv.
In public cloud, everything is the network. In public cloud, a disk attached to a SoftNAS is provided over the network to a SAN in the provider data center, so even the throughput to disk is affected by network on certain instance types. This network connection has to serve clients, serve the object puts and gets, and serve the reads and writes to the block devices.
Network IO will always be limited to the slowest device in the process chain. If the client accessing the shared storage on SoftNAS is an instance type that only has moderate network performance or burst-able network performance, then one should expect moderate or burst-able throughput from that instance when accessing the SoftNAS shares.
Verify the network throughput by looking at 'SUM' values over time in the cloud provider portal (Cloudwatch for AWS, Metrics for Azure) and also verify if the throughput is what is expected for the instance type.
Assuming you get somewhere around 50Mb/s on instances that are rated 'low' network performance.
We can assume to get somewhere between 150Mb - 300Mb/s burst on instances with 'moderate' network performance depending on the class type. (c4, m4, r4, etc)
We can assume to get somewhere around 1Gb/s on instances with 'high' network performance.
Instances rated at *up to 10Gb are burst-able up to 10Gb sometimes, not dedicated 10Gb throughput. Expect a baseline performance around 1200Mb/s
Instances rated at 10Gb network are SLA'd at that level by the cloud provider.
Refer to the below example using an M4.Large which has 'moderate' network throughput:
Network in + out = ~5,000,000,000 Bytes (5 GByte) over 5 Mins (1GByte Min avg roughly)


At the same time on the SoftNAS, in the SAR logs, there's a high number in TCP transmit-wait (TCP-TW is the last column)
![]()
Conclusion regarding network bottleneck:
- Based on what is expected at a network speed for this instance, what the platform monitoring is showing, and the fact that operations are being held up waiting on network transmit, we can assume that the performance bottleneck is currently the network speed of the instance-type where we have deployed SoftNAS.
- Enabling encryption in flight also has network performance implications. Encrypted replication streams cause the network transfer to become dependent on CPU cycles rather than available bandwidth. This may become a performance bottleneck during the initial-sync of a large volume.
- Use jumbo frames whenever possible (mtu 9001 not applicable in Azure)
- If using Azure, provision instances that have the Accelerated Networking feature whenever possible.
Disk, IO Wait, and Storage Type.
In the same way that congested networks can cause IO Wait, exhausted disk devices will have the same effect.
Each cloud platform provider provides different storage options of different characteristics.
In general, the slower the medium (object, blob, HDD) the less expensive it is.
The storage type will determine how fast data can be written and accessed by SoftNAS and is ultimately the read/write performance.
Block Storage Devices
Block storage refers to SSD's HDD's and most managed disk types.
Block storage is typically allocated at an SLA'd throughput for the premium types (i.e. 250 MB) or guaranteed at a number of IOPS (3 IOPS per GB).
To diagnose issues with block device throughput we can use 'iostat' along with metrics provided by the cloud platform.
The telemetry data that we will look for is %iowait and %util for any block devices.
'iostat -x 1' will show you block device statistics for all devices, updated every 1 second
If you refer to the below output you can see that there is a high %iowait, %w_await, and %util for my device labeled 'nvme1n1'.

If the disk is 50GB so expect to get around 150 IOPS (3 IOP's per GB)
The below graph from the cloud provider shows that we pushed ~900 IOP/ sec over 5 minutes avg.

Conclusion regarding block device throughput:
Divide that 900 IOPS avg by the 5 mins and you see that we got ~180 IOP/sec which is about what the disk should max out at.
Based on the %util from the iostat output and some confirmation from the cloud provider metrics we can confirm that the bottleneck is the disk that the pool is deployed on. Then it is exceeding the allowed IOPS for that block device.
Object Storage Devices
Object storage devices refer to S3, Azure Blob, and OpenStack Swift containers being used as disk devices.
Reading and writing is handled via HTTP GET request (for reads) and HTTP PUT request (for writes).
The public cloud platforms each limit the throughput of a blob object to around 500 requests or just under 60MB/sec depending on which platform.
The best way to diagnose any performance issues related object storage devices is to refer to the SoftNAS logs.
Look for 'Delaying query', 'EC', and 'Error' messages from the s3backer process.
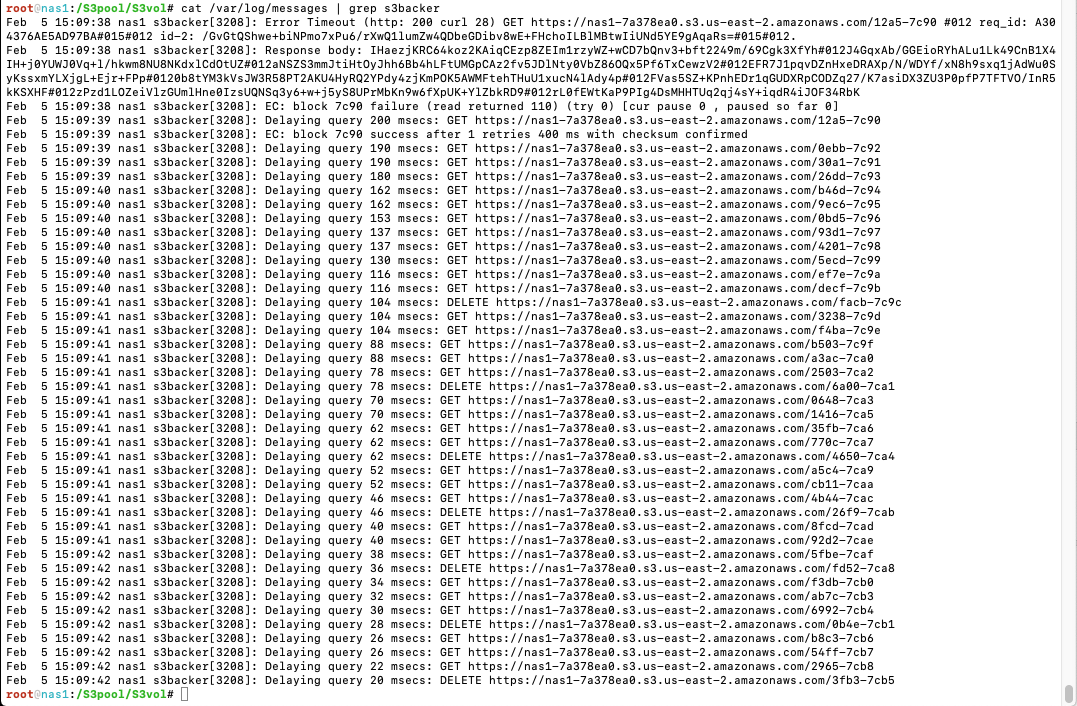
Conclusion regarding object device throughput:
The above means that the system is overrunning the allowed throughput to the object backend and the platform is telling us to back off with the requests.
In this case you either need to back the load off from your clients if you want to continue to use object disks or move the SoftNAS pools to faster block storage devices with more consistent throughput characteristics.
There is nothing we can do as these throttles are imposed by the platform.
RAM and SoftNAS Performance
Usable system memory is another key performance factor in how SoftNAS operates.
The SoftNAS kernel is tuned for file services so it does not behave as how it is expected in a standard virtual machine or file server to behave.
The appliance will always consume whatever physical RAM it has available for file system caching and ZFS metadata operations. That's a good thing because serving from RAM and L2ARC is faster than serving files from disk.
The general behavior will be that it will consume most of the RAM it can for file operations, however the dynamic back pressure provided by ZFS should never allow it to SWAP.
How much RAM it can give back depends on the number of open file handles, exported mount points, number of connected clients, and the file sharing protocol (NFS or CIFS).
The only way to reclaim any of the RAM that ZFS is currently allocating would be to export and and then re-import the zpools (zpool export pool_name,zpool import pool_name).
Exporting and importing a pool would obviously cause an outage for that file system so its not a recommended practice. You will likely hit that same memory threshold again as files are accessed and cached.
If the instance running SoftNAS on is swapping, then that is an indication that the RAM needs to be scale up on that instance type to handle the current number of file operations.
Using the command 'free -m' to quickly see RAM allocation and check to see if the system is swapping: (below)
free -m
total used free shared buffers cached
Mem: 32149 28322 3826 0 55 348
-/+ buffers/cache: 27918 4230
Swap: 4095 1237 2858
Conclusions regarding RAM resources:
From the above example it shows that the system is swapping and needs to be scale up beyond 32GB of physical RAM if you want to operate at this current load.
The more RAM added to a system, the more it can cache from RAM if other dependent resources allow.
Protocols like SAMBA/CIFS consume more RAM due to having to store extended file attributes (x-attr's) like when integrated into Active Directory.
Enabling deduplication on SoftNAS is going to consume more RAM as it has to maintain dedupe-tables.
Using object-backed pools (Azure Blob, S3, or Swift) it will consume more RAM as the blocks are held in cache while they are being chunked and uploaded or downloaded.
CPU and SoftNAS Performance
CPU load is a measure of how many instructions we have sitting in the system bus queue waiting for the processor to execute.
A true CPU load issue happens when there is not enough total CPU time available to handle the number of concurrent request coming into the system bus.
CPU's work in a FIFO buffer (First In First Out), so let's also keep that in mind.
Typically two things will be affecting your CPU load on SoftNAS:
- Number of processes in relation to number/speed of CPU cores. This includes long running processes that stack up on top of each other.
- IO Wait. If the CPU is waiting on IO from network or disk, then processes stack up in the execution queue.
Exhausted CPU:
Check processes in 'top': compare number of tasks, to %wait, %user, and %system.
Refer to the below example showing the output of 'top' regarding number of 'Tasks'.
In this example the system have 1001 simultaneous write threads going to 1001 different directories at one time and the SoftNAS node only has 2 cores.
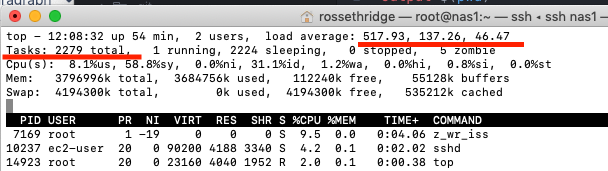
The load average is above 517 and that is because there are a total of 2279 tasks running at once.
Its difficult for 2 CPU's to handle that many long-running processes so its backed up 517 deep in the queue.
In that example the IO wait is low (1.2%wa) and all the CPU time is going to system (58.8%sy) and user (8.1%us).
This was a classic example of just needing more CPU to handle the number of requests.
Waiting CPU:
CPU waiting on IO request to/from network or to/from disk will also cause a CPU load condition.
Refer to sections one and two of this doc (Network and Disk) regarding how to diagnose which component is causing the condition.
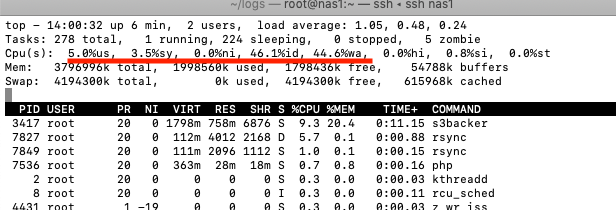
In the above example you can notice that all the CPU time is going to %wait (44.6%wa) and %idle (46.1%id) and the performance is slow.
There are only 278 total tasks running so the load average of 1.05 still seems high for 2 CPU's.
In this example we will need to go look at disk throughput and network throughput metrics to understand this CPU wait condition.
Conclusion regarding CPU bottlenecks:
The two frequent conditions regarding CPU bottlenecks are going to be related to the number of processes or CPU waiting on an underlying IO subsystem.
The 'number of processes' problem will grow as customers add 'number of volumes' to the replication cycle. When you start reaching a high number of volumes on a deployment, the CPU will become consumed with long-running replication tasks, about 5 tasks per volume.
- snapshot
- zfs send
- zfs recv
- zfs diff
- merge
- repeat next minute for every single volume
Enabling the ZFS compression feature will consume more CPU time.
Enabling the volume encryption feature will consume more CPU time.
Enabling in-flight encryption for replication will consume more CPU time (and also affect network performance).
Client Type, Protocol, and SoftNAS Performance
Different network clients and operating systems will behave differently when accessing the same shared volume on SoftNAS. Sometimes mount options on the client side can help. Sometimes mount options cannot help and it's just a characteristic of that client type. Also choosing the right protocol for the right client becomes important. One would probably not want to use NFS for Windows clients and probably would not want to use SMB/CIFS for Linux clients. Try using jumbo frames whenever you can.
NFS
- NFSv3 clients will behave differently than NFSv4 clients.
- It's a fundamental change from default UDP (v3) to default TCP (v4).
- NFS clients that are *NIX or Solaris based will outperform Windows based NFS clients.
- Thats more related to NFS being a non-native System32 app in Windows.
- Tuning the rsize, wsize for the network and setting options like _netdev and intr in the mount options on the client will have significant impact.
- For example, if you have jumbo frames enabled and a rsize and wsize of 8192, it can push line speed of the ec2-instance client in AWS.
- Common NFS client mount options and explanations can be found here:
CIFS/SMB (and Active Directory)
If we are exporting shares as CIFS/SMB then we can assume it's likely for Windows clients. We should also take into consideration whether or not these shares are integrated into Active Directory. Getting extended attributes and checking permissions against an Active Directory server will add to the transaction time.
- DNS response time and reachability are also very important factors when dealing with AD domain resolution. Any DNS or AD related issues will amplify any performance problem.
- Native Microsoft SMB servers may outperform SoftNAS in some cases if the attached Microsoft clients are taking advantage of the direct memory access and multi-channel capabilities not available in the open-sourced SAMBA service on the appliance. Also the SAMBA daemon runs in 'user space' on our appliance which is inherent of performance and resource restrictions.
- Just like NFS, some tuning can be done on both the SMB client as well as server side to attempt to increase performance. Tweaks to sockets, opportunistic locking, TCP options, and the send and recv buffers. None of this is recommended by the SAMBA organization but these are all options in smb.conf
- Refer to this external blog post for a good read regarding the context of changing specific parameters:
- Refer to this blog post from Samba telling us not to mess with those same parameters:
- https://wiki.samba.org/index.php/Performance_Tuning
"The Samba team highly-recommends not setting the parameters described in this section without understanding the technical background and knowing the consequences.
In most environments, setting these parameters or changing the defaults decreases the Samba network performance."
- https://wiki.samba.org/index.php/Performance_Tuning
Throttling
The public cloud pricing model is based on throttles. As you pay more money, you get devices and compute resources with higher limits and less throttles.
As discussed in previous topics, you will hit a maximum throughput number set by the cloud provider for that device or compute instance.
These are the platform throttles that you have to keep in mind and can be verified by referring to the cloud provider SLA:
- Max throughput allowed for a disk device type.
- Max throughput allowed for a network interface.
- Max throughput allowed for a virtual machine type.
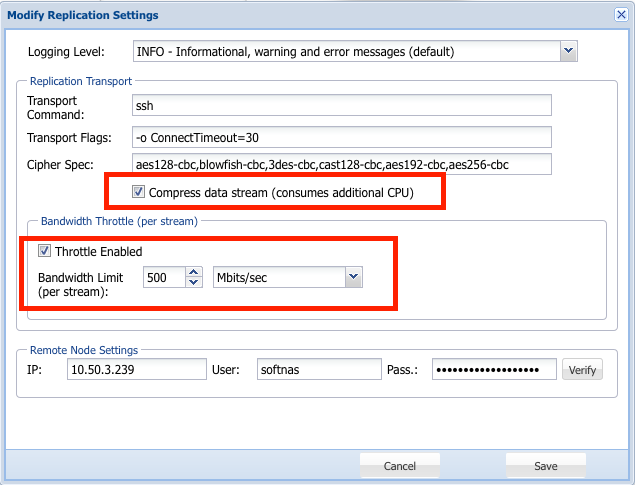
There are also artificial throttles that can be imposed at the software level on SoftNAS. (see below)
- Bandwidth throttling in the replication settings. (default is 500M)
Some throttles may be unintentional. (see below)
- Enabling data stream compression will unintentionally throttle the network bandwidth throughput as it has to now wait on CPU cycles to compress/decompress every data packet.
Conclusion regarding throttling:
When it comes to throttling it's important to be aware of any limits imposed by the cloud provider, which are beyond our control, and to be mindful of any software throttles that we may have imposed intentionally or unintentionally.
Housekeeping
There are a few housekeeping issues that can also affect SoftNAS performance. The three that you commonly come across are issues related to disk space, logging, and volume fragmentation.
Available disk space on the root drive for SoftNAS version below 4.4.x
Currently the root volume of SoftNAS version below 4.4.x only has a 30GB file system. If regular housekeeping and on the root volume is not kept in check, then there is potential for it to become full. When the root volume becomes 100% utilized processes fail and the UI stops responding as it can no longer log authentication attempts. The four main places you may have to truncate at times are:
- The system logs directory: /var/log
- The SoftNAS application logs directory: /var/www/softnas/logs
- Temporary files from software updates and session files: /tmp
- Sometimes root's home directory can contain some hidden surprises: /root
To tell how much space the subdirectories in your root volume are consuming you can run the below command at the CLI:
du -xh / 2>/dev/null | sort -h -r | head -n 15
- Or refer to this link: How to find the directories that are occupying the most space on the system?
Logging:
Logging can also affect performance of the appliance.
- Leave SoftNAS logging levels at 'info' unless troubleshooting and have a need to set the log level to 'debug'. The amount of logging provided by debug level can fill up the root volume as well as eat into the allowed IOPs on the smaller root volume. Turn logging levels back to info when you are done debugging.
- If running out of space due to logs is a regular problem then we can look at growing the root file system (offline procedure) or adjusting the frequency and expiration of logs being handled by the logrotate daemon (/etc/logrotate.d/)
Available space in the ZFS pool:
The amount of free space affects how ZFS writes data to the pool devices.
- Keep pool free space above 10% to avoid many metaslabs from reaching the 5% free space threshold to switch from first-fit to best-fit allocation strategies.
- The command 'zdb -mmm $YourPoolName' will show this information (see below)
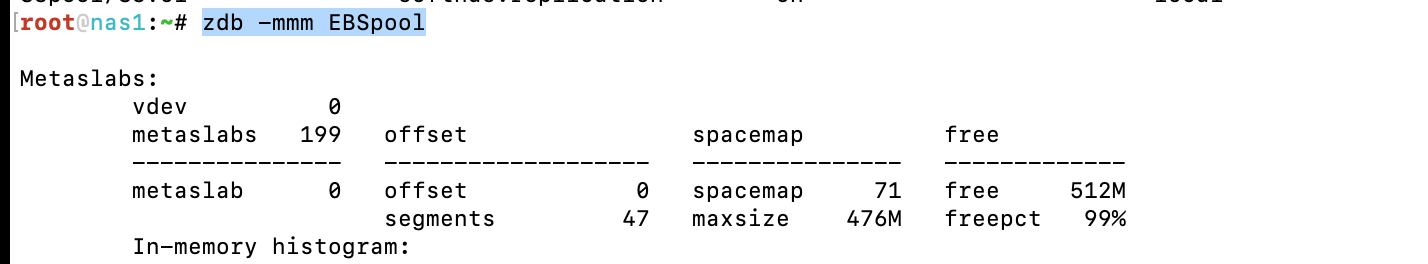
Fragmentation in the ZFS pool:
The output of 'zpool list' shows a value of %FRAG. The FRAG value is an abstract measure of how fragmented the free space in the pool is. The FRAG percentage tells you nothing about how fragmented (or not fragmented) your data is, and thus how many seeks it will take to read it back. (see below). Obviously more fragments in free space means you will be doing more random reads and writes moving forward which will have a big impact on how quickly the file system can perform.
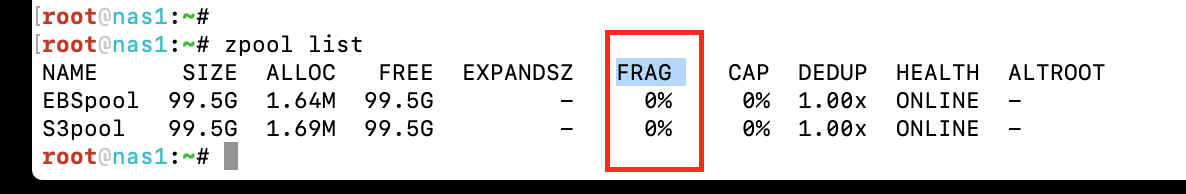
The above example shows that all the remaining space in the pool is located in contiguous sectors with no fragmentation. It should be this way because this is a newly created pool and there's no data deleted from it or reclaimed any sectors to be re-written by ZFS.
- If you notice a high level of fragmentation in your zfs pools (above 10%), you should consider re-writing the pool data to new devices using a method like zfs send/recv to self.
Conclusion regarding housekeeping:
Housekeeping issues are not always the most obvious when troubleshooting performance related problems, but as you can tell from above, they can have a huge impact on the performance of the appliance. We need to be mindful of available disk space in the storage pools and the root volume as well as look out for fragmentation on the devices. We also need to be mindful of how we handle logging and log rotation as all of those can impact performance.